

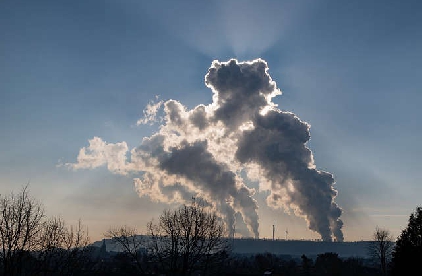
The parts of the city which have the biggest carbon footprints have been revealed.
Several parts of Worcester have been singled out for having massive carbon footprints on a new map which grades each area for the amount of pollution they create on average per person.
Three neighbourhoods have produced so many greenhouse gases on average that they are among some of the biggest polluters in the country.
The biggest carbon footprint was found on the edge of the city around the north-eastern part of Warndon Villages and part of the industrial estate around junction 6 of the M5.
The map was created using various government statistics and looks at energy consumption, heating, flights, car and public transport usage and consumption of goods among others with the lowest carbon footprints receiving an ‘A’ grade all up to the biggest polluters which get an ‘F’ grade.
The area was the only in the city to be given an ‘F’ grade and was singled out for car and van usage, the number of flights taken and the consumption of goods and services.
Two out of three of the city’s ‘F+ grade’ neighbourhoods – which means they are in the worst 10 ten per cent of neighbourhoods in the country – with the biggest carbon footprints were in St Peter’s.
Every person in the first neighbourhood, which includes homes from Wheatfield Avenue off Bath Road to the north right down to the Southern Link Road, and the second on the eastern side of St Peter’s, which combines homes from Crookbarrow Way upwards until they meet Battenhall, were creating an average of 12,600 units of kilogrammes of carbon dioxide equivalent (kgCO2e) – almost 350 per cent higher than the government’s 2023 target.
The target of 2,849 kgCO2e is intended to provide an indication of how the country must go in the next ten years if it is to have any chance of reaching net-zero by 2050.
Both areas in St Peter’s were singled out for high car usage and the number of flights as well as consumption of goods.
Worcester’s carbon footprint is very slightly below the UK average of 7,852.5 kgCO2e.
According to the map, the neighbourhood with the smallest carbon footprint in Worcester is Ronkswood and at an average of 3,910 kgCO2e per person is closest to reaching the government’s 2023 target.
 Worcester's £5 million Levelling-up plans revealed
 Severn Stars Will Need to be at Their Best Against League Leaders, says Coach
 Investigation launched after two deaths in Redditch